What is report automation?
Finish your demo booking
Looks like you haven't picked a time for your personalized demo. Pick a time now.
Select date and time
Gain insights into team performance with automated reporting systems. Make data-driven decisions with accurate data while saving time and lowering administrative costs.
No credit card required


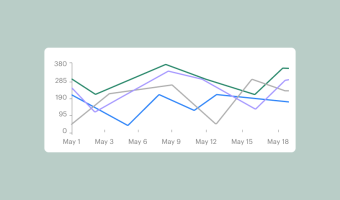
Automated reports are reports that are generated automatically, usually on a recurring schedule. This type of report generation pulls data from various sources, processes it, and presents it in a readable format like a chart or table.
Generally, automated reports work best where reporting needs are consistent, or where the same set of data needs to be measured against new datasets or past results. In these scenarios, automated reports are useful for tracking metrics over time while trying to make decisions that improve a process or outcome.
At PandaDoc, automated reports can be used to instantly gather real-time data on documents, users, revenue, template usage, recipient actions, and much more. These insights give teams an opportunity to optimize their document processes for an improved quote-to-cash process.
Eliminate human errors when gathering data. All PandaDoc reports are available with just a few clicks.
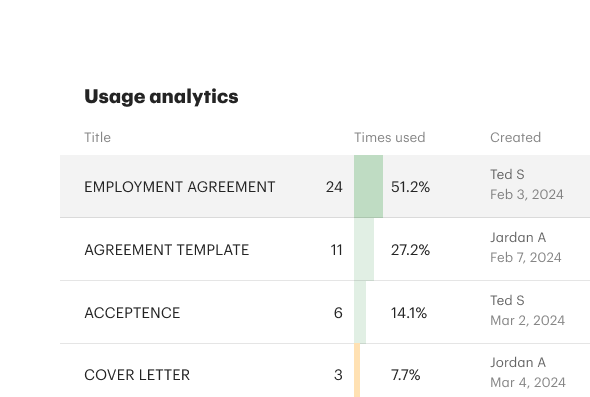
See which documents are used most often, how much revenue they generate, and how reps and users interact with them.
Resolve trouble spots in your most-used documents so that recipients close deals faster than ever before.
Monitor team performance without specialized apps, integrations, or APIs. Use onboard reporting processes to review rep performance, efficiency, and other critical sales data.
Tracking these metrics allows you to identify top performers, areas for improvement, and potential training needs within your sales team.

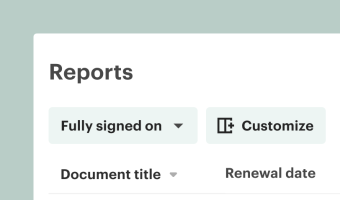
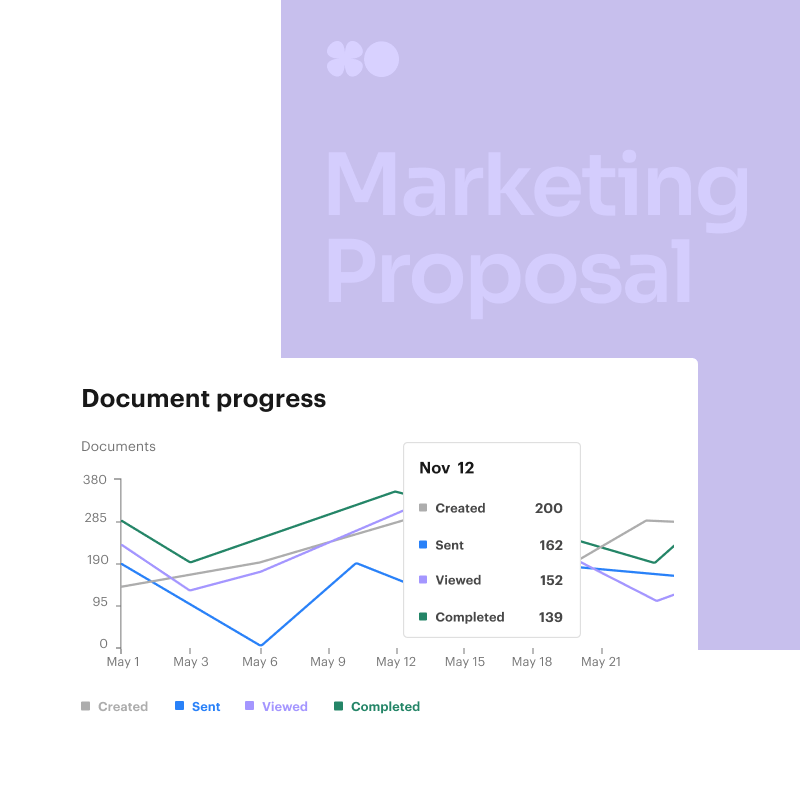
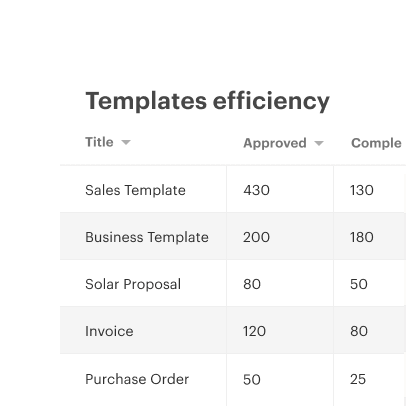
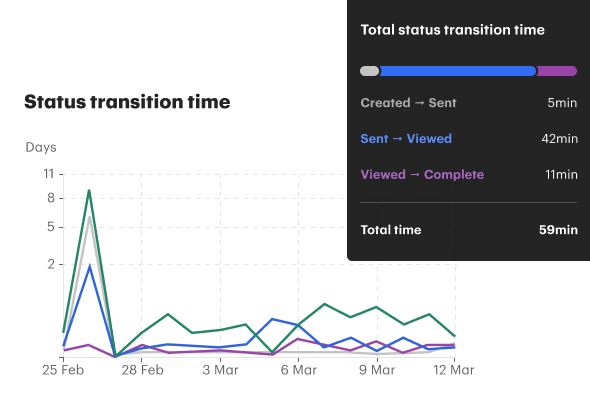
Gain essential insights into your document lifecycle without time-consuming, manual reporting. Monitor document creation processes, approval flows, and completion rates for a clear view of process efficiency.
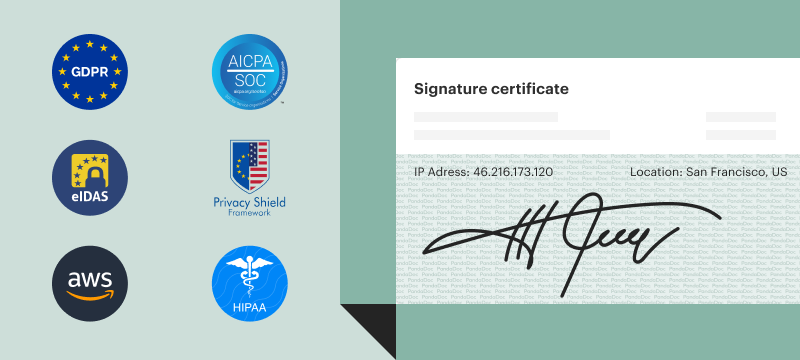
PandaDoc ensures data accuracy by tracking document status, allowing for a more informed decision-making process.
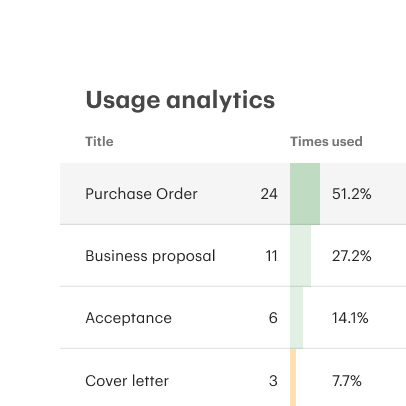
Discover which templates and snippets in your content library see the most use. Assign project management resources to implement revisions and updates for priority templates and blocks.
By focusing on frequently used templates, you can maximize team productivity while improving overall document quality.
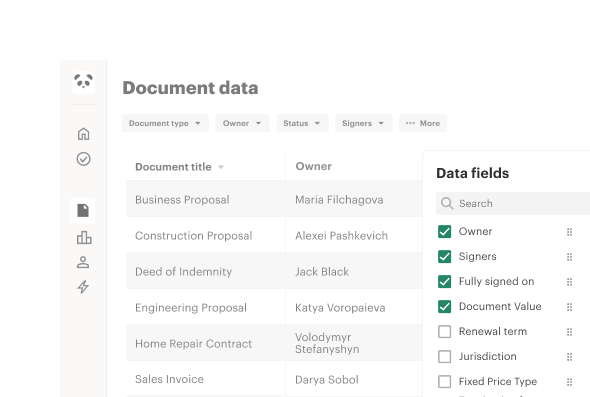
Whether you need to forecast sales or implement a new training policy, PandaDoc provides filtering tools so that you can gather the data you need in record time.
Quickly sort and analyze your data based on specific criteria, including date ranges, user roles, and document types. Make informed decisions without wasting valuable time searching for the right information.

Manager Partner Revenue River

Use content tools to design stunning proposals entirely from scratch. Track proposal views and engagement to better understand how clients interact with your offers.
This data allows you to tailor proposals for higher conversion rates and identity areas for improvement in your sales pitch.

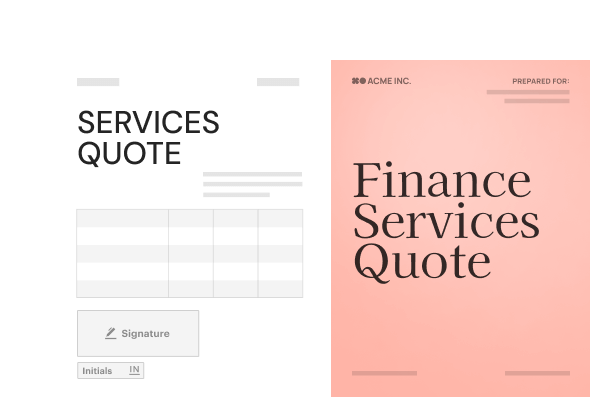
Generate quotes using built-in pricing tables and a native product catalog.
Monitor quote acceptance rates and identify which products or services are most popular among clients. Analyze pricing trends and adjust your quotes to optimize profitability.
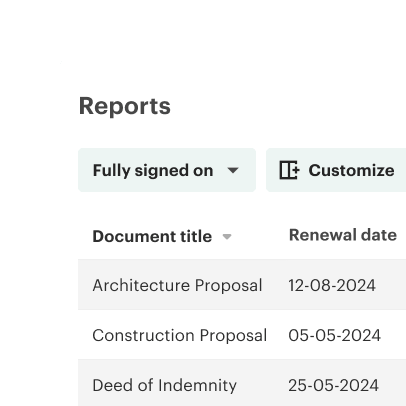
Create, manage, and negotiate complex contracts throughout the entire document lifecycle. Track contract renewals, monitor compliance, and identify potential risks.
Use reports to gather insights into performance and proactively address issues to ensure favorable outcomes.

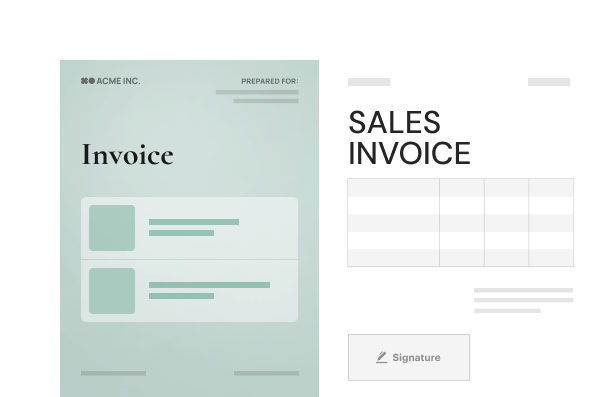
Build professional invoices with customizable templates and automated payment reminders.
Track invoice status, monitor payment trends, and flag potential delays.
Following reports helps you maintain a healthy cash flow, and data can be used to analyze customer payment behavior or identify areas for improvement during the invoicing process.
Get personalized 1:1 demo with our product specialist.
PandaDoc reporting tools are available as a paid add-on for Business Plans and by default for Enterprise plans.
Please note that only account owners and individuals with Admin or Manage roles can access this feature.
Users with the Manager role are only able to review reports and data for their assigned Workspace.
Raw data can be exported from PandaDoc in a CSV format.
Import that file into Microsoft Excel, Tableau, or another BI tool, and customize to taste.
Interactive visualizations and dashboards can’t be saved or exported.
Partially.
PandaDoc generates business reports based on data automatically captured through software usage, including details like close rate or document progress.
During report creation, it’s possible to change the visibility of specific data sets by using the onboard filtering tools.
However, it’s not possible to track systematic metrics that PandaDoc doesn’t track by default.
Because PandaDoc’s automated reporting tools are generated using real-time data, it’s not possible to schedule reports in advance.
However, data from specific time frames (day, week, month, etc.) can be generated quickly within the reporting tool, so it’s easy to gather accurate data at any time.
The type of data visualization available depends on the report.
Most reports are available as either a line or a bar graph, and many are interactive, meaning that users can gain access to in-depth information by hovering over specific elements on the graph.
A few reports, including reports surrounding document efficiency and the content library, are only available in a spreadsheet format.