If you work in software-as-a-service (SaaS) or a subscription-based software business, chances are that you’ve come across two essential metrics: ACV (annual contract value) and ARR (annual recurring revenue).
While they sound similar and are often confused for one another, these two metrics serve very different purposes:
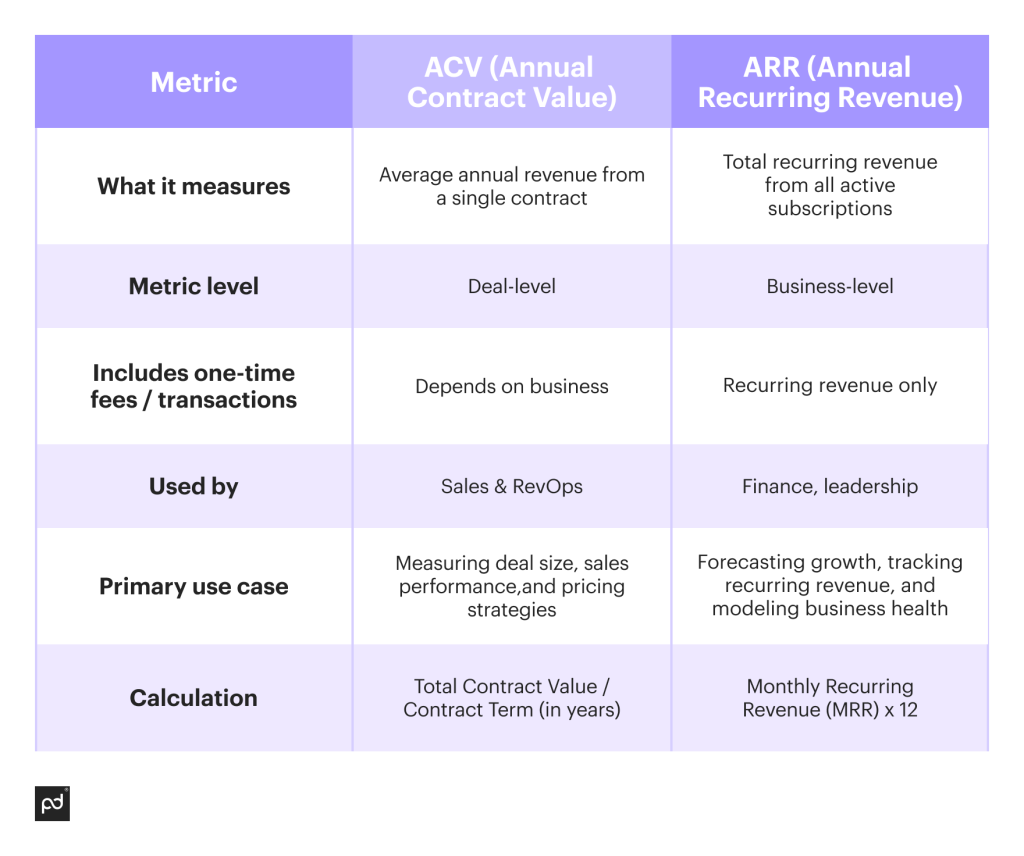
- ACV shows the average value of a specific customer contract.
- ARR tracks recurring revenue over a set amount of time.
For teams looking to track performance, forecast revenue, and make smarter business decisions, understanding both metrics is essential for long-term success. Each metric gives a unique insight that can be essential for decision-making, especially around pricing strategies and term contracts.
In this guide, we’ll break down what each metric means, how to calculate them, when you should use them, and how they work together.
What is ACV (annual contract value)?
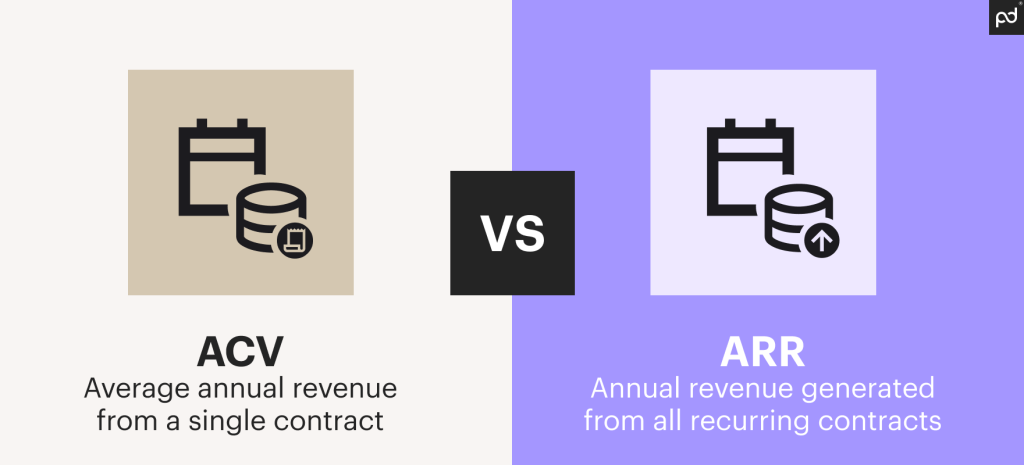
Annual contract value represents the average revenue that a single contract generates over a 12-month term.
For SaaS brands — especially those offering monthly or annual terms — ACV is fairly simple to calculate. However, the metric can also be applied to contracts of any length, including multi-year deals with lump-sum payments, by standardizing their value on an annual basis.
Example: If a customer signs a three-year contract for $90,000, the ACV is $30,000.
This metric is useful for SaaS companies because it allows teams to normalize contracts across varying terms, making it easier to compare deals and track sales performance.
When to use it
ACV is useful as a KPI when you’re evaluating deals over time or comparing contracts of different length to better understand your revenue stream. If your organization offers subscription contracts that extend beyond monthly and annual terms, total revenue alone doesn’t always reveal which contracts are the most valuable.
By analyzing contract values, ACV gives you a clearer view of which customers generate the most recurring income. This makes it easier to prioritize high-value accounts for customer success and retention strategies.
This metric is also useful when evaluating the performance of sales reps and teams. With a clear ACV benchmark, it’s much easier to set accurate quotas, stretch goals, and compensation plans based on average deal value.
How it helps
One of the biggest advantages of ACV is consistency By breaking down contracts to an annualized metric, teams can more easily track trends, measure growth, and align on what makes a “high-value” customer.
Once those definitions are established, it’s easier to create strategies that raise customer value over time. New customers and lower-value accounts can be targeted with upsells and cross-selling initiatives designed to raise their total value, generating greater profits over time.
ACV can also signal risk. If valuable accounts begin to show a downward trend through cancellations, downgrades, or renewals, it may be a red flag for customer churn.
How to calculate it
Annual contract value is easy to calculate by using a simple formula:
ACV = Total Contract Value / Contract Term (in years)
You’ll also need to decide what you intend to include in your calculation. One-time fees, add-ons, or services can be factored in, but doing so may distort or overstate a customer’s long-term revenue contribution.
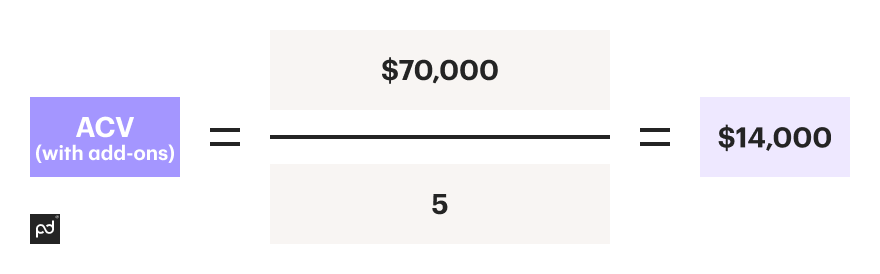
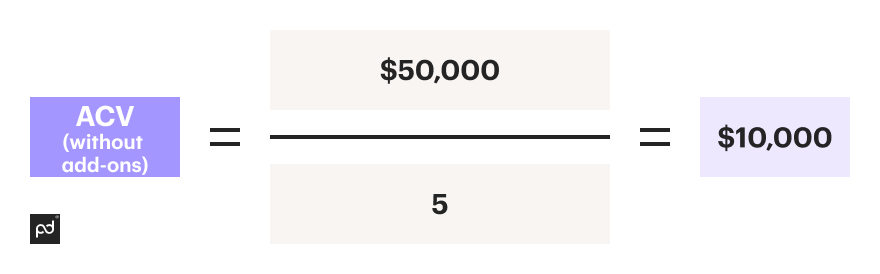
Example: Assume a customer buys a $10,000 annual subscription on a five-year term ($50,000) and spends $20,000 of product add-ons in their first year. For the remainder of the term, they only pay for the subscription.
- ACV (without add-ons): $50,000 / 5 = $10,000
- ACV (with add-ons): $70,000 / 5 = $14,000
If you calculate ACV with those add-ons included, the account value will be higher than the customer’s average monthly spend because of those first-year charges.
The right way to calculate ACV will come down to your business model, how teams typically sell products and services, and which numbers give the greatest insight into your customer base.
Regardless of what you choose to do, the calculation needs to be consistently applied across all accounts so that ACV is properly defined within the scope of the business.
What is ARR (annual recurring revenue)?
Annual recurring revenue (ARR) represents the total predictable revenue a company expects to generate from active subscriptions over a 12-month period.
While ACV focuses on individual deals, ARR reflects your overall recurring revenue across all customers. For SaaS businesses, it’s a critical metric because it helps teams measure long-term financial health and track revenue growth over time.
Example: If your business generates $100,000 in subscription revenue each month, your ARR would be $1.2 million.
However, ARR doesn’t include one-time charges, implementation fees, or services. It only accounts for revenue that recurs on a consistent, annualized basis.
When to use it
ARR is best used when tracking overall business growth, forecasting future revenue, or evaluating the long-term impact of customer acquisition and retention strategies.
It’s a key SaaS metric for finance teams, leadership, and investors who need a high-level view of the company’s revenue model and overall scalability. You’ll commonly see it used in SaaS valuations, funding rounds, and strategic planning.
Keep in mind that while ARR provides valuable insights into the predictable revenue an organization can generate, it doesn’t tell the whole story and isn’t designed to do so.
How it helps
ARR provides a reliable view of a company’s revenue stability and growth trajectory over time. This helps teams spot trends, monitor expansion or contraction with accounts, and model future earnings with much greater accuracy.
When tracked over time, ARR also reveals the health of your customer base. Rising ARR might reflect strong net retention or successful upsell initiatives while a declining ARR could signal high churn, a shrinking customer base, or a shift away from a recurring revenue model toward alternative revenue streams.
Because ARR doesn’t give complete insight into a company’s financials and tends to function as a high-level overview of a company’s revenue stream, it’s important to combine it with other metrics — churn rate, net revenue retention, etc. — in order to get a clearer picture of how the business functions.
How to calculate it
ARR is typically calculated using monthly recurring revenue (MRR) with a simple formula:
ARR = MRR x 12
This assumes that your revenue remains consistent month over month. If your contracts are billed on varying terms, you’ll need to annualize each term to determine ARR.
Example: Your company sells annual, monthly, and custom-term subscriptions. To calculate ARR, you’ll first need to determine the annual value for each active contract.
-
Customer A is on a $24,000/year plan = $24,000 added to ARR. (No additional calculation needed.)
-
Customer B is on a $6,000/month plan = $72,000 added to ARR. ($6,000 x 12 months.)
- Customer C paid $63,000 for a three-year term = $21,000 added to ARR. ($63,000 / 36 months x 12 months).
Remember: ARR calculates recurring revenue, it’s important to exclude one-time purchases, setup fees, or usage-based charges from ARR. These fees do not recur and will distort your view of long-term revenue.
How ACV and ARR work together
Even though both ACV and ARR are key metrics and commonly positioned as KPIs, they’re often discussed in isolation.
In reality, they work best when paired together. Each metric provides a different view into your revenue structure, and neither gives a complete picture of the business. Using them together allows teams to make better, more confident decisions around forecasting, growth, and overall strategy.
When used together, these metrics do each of the following:
Provide different views of revenue
ACV and ARR cooperate at different levels of granularity.
ACV looks at individual contracts and breaks each deal into its average annual value. That’s helpful when comparing accounts, tracking sales, or evaluating pricing models.
ARR looks at aggregate recurring revenue across your entire customer base. With it, you’ll know how much consistent, recurring revenue you’re generating on an annual basis. That gives you a clear baseline of business performance and financial wellbeing over time.
However, each view is different. One is tactical and one is strategic. Where ACV gives you a better understanding of deal quality, ARR helps you understand the momentum of the business as a whole.
Used by different teams for different goals
In most organizations, ACV is owned by sales and revenue operations, who use it to assess performance, set goals, and identify valuable customers. These insights can also trickle into other departments.
For example, when sales teams use ACV to isolate a new customer segment, that information can be used to develop marketing strategies that pull in similar users. Product teams may develop new subscription plans or add additional features designed to encourage signups or upgrades, leading to increased conversion rates and customer retention.
ARR is typically owned by finance and leadership teams, who use it to forecast revenue, track growth, and report progress to a board of directors or group of investors. Over time, ARR can be used to monitor company health — especially in SaaS businesses, where predictable revenue is critical.
Understanding both metrics ensures alignment between what sales teams are optimizing for and what the business needs to sustain and scale.
Improve forecast accuracy
Neither ACV nor ARR can give you a complete forecast on their own.
-
ACV will show average deal size, it doesn’t reflect churn, renewal rates, or the total number of customers.
- ARR shows all recurring revenue, but it doesn’t show how that revenue is generated.
Teams who want to be more accurate with their sales forecasting will need both numbers in order to better understand how the business operates and where opportunities for improvement reside. While the high-level overview shown by ARR provides a reference point for overall growth, changes around subscriptions and orders will only show up there as revenue rises and falls.
For example, ARR could be growing while ACV is dropping because you’re adding customers but signing smaller contracts. This can be useful for planning, but it could also signal future trouble, especially if those newer contracts expire in a shorter period of time.
Align sales and finance strategies
When ACV and ARR are aligned, it’s easier to bridge the gap between sales activity and business outcomes. Teams can set sales goals that directly impact revenue targets rather than focusing only on volume or activity metrics.
Example: The finance team sets a goal to increase ARR by $1 million in Q1.
Sales teams can reverse-engineer how many deals they need to close at a given ACV in order to reach that goal, whether it’s realistic, and what steps need to be taken in order to create success.
Keeping these numbers in sync with one another and carefully considering each metric before making major decisions allows teams to better communicate, strategize, and stay accountable.
Enable smarter growth decisions
Together, ACV and ARR help companies scale with clarity.
Leaders can see where the revenue is coming from, how pricing, packaging, and retention strategies impact the bottom line. Teams can work together to uncover weak spots in the customer lifecycle and, after attempting a fix, can compare against previous metrics to measure performance.
Zooming out, both ACV and ARR can inform everything from hiring decisions to product development and investor onboarding. But they provide the best insights and allow for the greatest positioning when considered together.
Common mistakes to avoid
Even though ACV and ARR are widely used in SaaS, they’re often seen together and commonly misunderstood. Using either metric incorrectly can lead to bad forecasts, misaligned business strategies, and misleading performance reporting.
Here are some of the most common mistakes to watch out for when using these metrics:
-
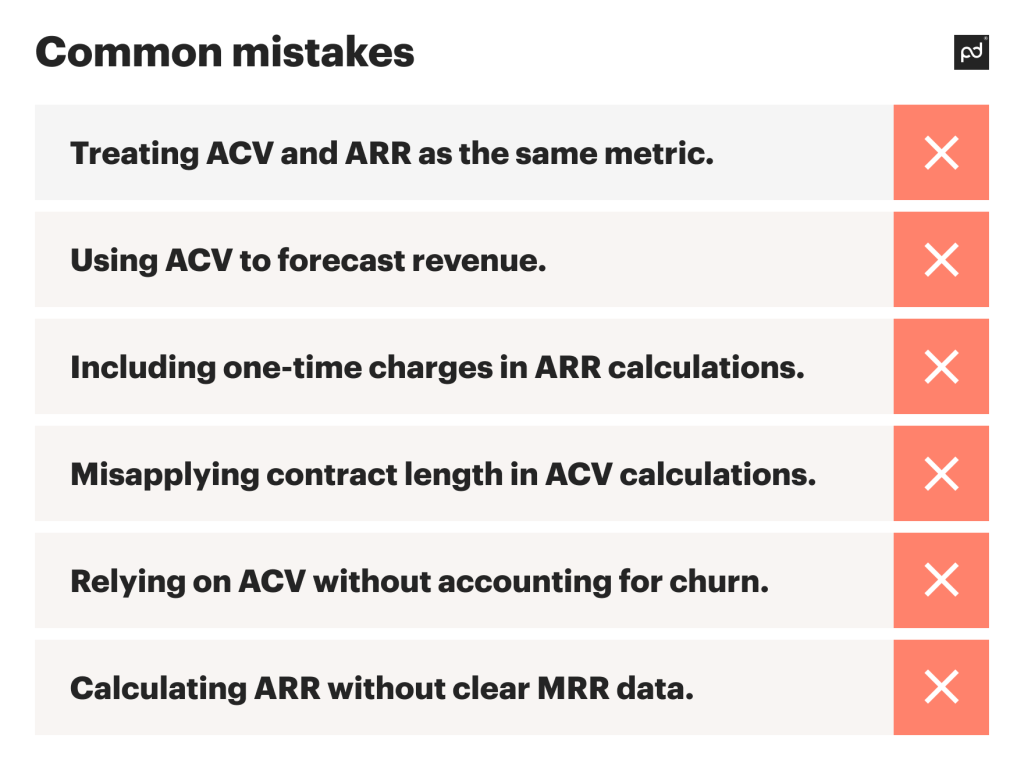
Treating ACV and ARR as the same metric. ACV is deal-specific and may include one-time fees. ARR is company-wide and only includes recurring revenue. Each is designed to show different data, and using them incorrectly will lead to poor outcomes.
-
Using ACV to forecast revenue. ACV shows average deal size, not actual recurring income. Forecasting based on ACV alone ignores, churn, renewals, and customer growth.
-
Including one-time charges in ARR calculations. ARR should only reflect predictable, recurring revenue. dding fees, surcharges, and one-time purchases inflates your numbers and misrepresents revenue stability.
-
Misapplying contract length in ACV calculations. ACV should reflect the average annual value over the full contract term. Failing to normalize deal length (e.g. treating a three-year deal as a one-year ACV) will skew your metrics.
-
Relying on ACV without accounting for churn. High ACV doesn’t guarantee long-term revenue and won’t show if they aren’t renewing or are being downgraded. Without additional metrics, you’ll miss those warning signs.
- Calculating ARR without clear MRR data. Because ARR is calculated based on MRR data, you can’t get a clear number without it. If your MRR isn’t clean, accurate, and consistent, ARR data will be tough to figure out.
To avoid these mistakes, start by clearly defining what each metric should track and making sure everyone on the team uses them consistently. Where possible, you might want to automate these calculations.
When ARR and ACV are used in the right context, they become powerful tools for driving smarter decisions across all aspects of the business. That matters, whether you’re a startup trying to increase monthly subscriptions or an established company looking to maximize annual revenue.
Other metrics to consider
ACV and ARR are both essential for tracking revenue and pricing, but they’re only one part of a much larger picture.
Here are a few other important metrics that will help you better understand performance, customer behavior, and long-term growth potential:
-
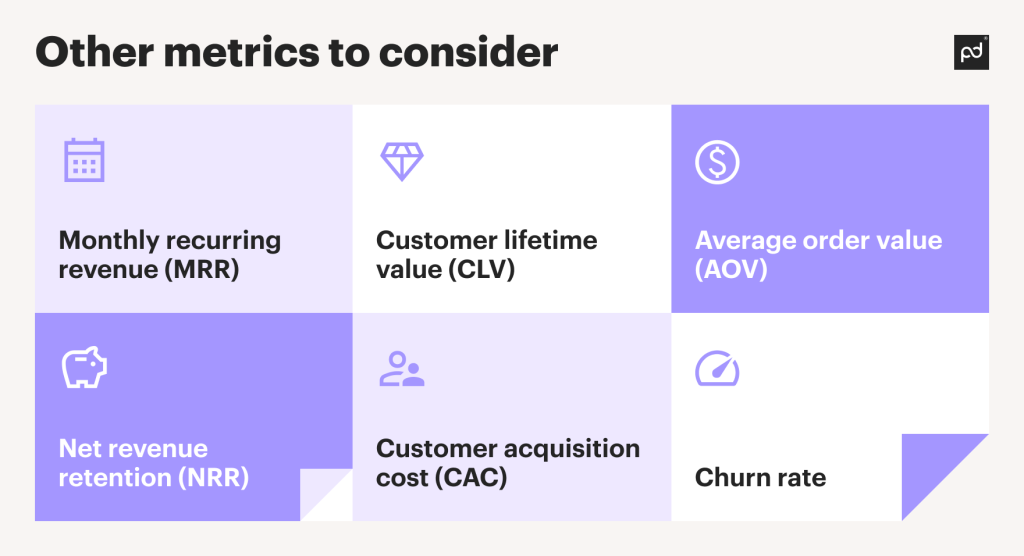
Monthly recurring revenue (MRR): The total predictable revenue generated from subscriptions on a monthly basis. This is required to calculate ARR, but it’s also used for more granular tracking than ARR provides, especially in early-stage businesses and startups without a trackable revenue history.
-
Customer lifetime value (CLV): The total amount of revenue you expect to earn from a specific customer over the entire relationship, including any fees, add-ins, one-time purchases, and subscriptions.
-
Average order value (AOV): The average amount a customer spends per transaction. While this sounds similar to ACV, it’s very different and is more common in e-commerce sales and traditional business models.
-
Net revenue retention (NRR): Measures revenue growth or loss from existing customers by factoring for account expansions, downgrades, and churn. This metric is always presented as a percentage, with 100% as the baseline and growth or loss presented as an over/under from that starting point.
-
Customer acquisition cost (CAC): How much it costs to acquire a new customer, including sales and marketing expenses. Pairing this with LTV will let you know whether your growth is sustainable.
- Churn rate: The percentage of customers or revenue lost over a given period. While some churn is a given, high churn weakens ARR and demonstrates clear gaps in onboarding, engagement, or overall product fit.
Knowing these metrics can help teams gain a solid understanding of how customers and accounts are tracked over their engagement with the company. Some relationships are quick, while others span a number of years.
By keeping a close eye on key metrics, it’s easier for brands to track customer lifecycles and mitigate churn with effective retention strategies at key moments.
Simplify your revenue metrics with PandaDoc
While similar on the surface, ACV and ARR tell very different stories about your revenue and overall business trajectory.
ACV zooms in on individual contracts while ARR zooms out to show company-wide momentum. When used together and paired with additional supporting metrics, these numbers can provide the insight teams need to make smarter and more strategic business decisions.
Unfortunately, tracking these numbers by hand can be extremely tedious. As a document generation platform, PandaDoc helps by offering trackable data that can be downloaded and used to quickly calculate these critical metrics.
Want to learn more? Sign up for a personalized demo and see how you can use PandaDoc reporting and analytics tools to level up your entire sales process.
Frequently asked questions
-
ACV is the value of a customer’s contract averaged over a year. It’s calculated by dividing the total contract value by its length.
-
SaaS bookings are the total sum of signed contracts with customers. This is before any money has been exchanged.
ACV, on the other hand, focuses on revenue for contracts over a year.
Both are essential factors to consider when dealing with contracts.
-
ACV (annual contract value) is the average revenue that a contract generates each year.
TCV (total contract value) is the total revenue expected over the entire term of the contract.
For example: A three-year contract worth $90,000 has an ACV of $30,000 and a TCV of $90,000.
-
Yes, and no.
ACV calculations deal with a specific contract and use the numbers in that contract within its formula. For example, a $50,000 contract with a five-year term has an ACV of $10,000.
ARR factors recurring revenue across all active contracts, so a specific contract would contribute to ARR, but ARR isn’t calculated from only that contract.
-
Definitely. ARR can decrease if you’re losing customers, even if your average deal size is going up.
In this scenario, the business is closing larger deals but not frequently enough to offset the loss of existing customers.
-
ARR is generally considered better for revenue forecasting because it reflects recurring, predictable income across the entire customer base.
ACV is valuable for understanding average deal size and sales performance, but it doesn’t account for churn or renewal behavior. This makes it less reliable for long-term projections.