From marketing to HR, reports drive the day-to-day running of every department.
Luckily, knowing how to automate reports removes much of the work in generating them, allowing teams to focus on growth-related tasks.
In this article, we’ll show you how to automate reports, explore different automation methods, and highlight some of the top automation tools available.
Key takeaways
- Report automation cuts out admin tasks and boosts growth
- Always set clear goals before beginning automation
- There are multiple automation options
- PandaDoc offers a comprehensive report automation solution
What is report automation?
This relates to software, which, as the title suggests, generates and files automated reports.
It massively reduces admin and ensures that reports are filed more quickly.
The ability to automate reports is critical, but is it risky to hand this task to a computer? In short, no.
A business report involves lots of data.
The bigger your organization, the higher the mountain of data, and the more reports you’ll need.
Employees aren’t perfect and may make mistakes handling so much data.
Report automation reduces this risk. Software has clear instructions that will be followed every time.
You set parameters for your reporting, and the automated tools don’t tire or lose interest.
They’re fast, reliable, and keep going until you tell them to stop.
Why should you automate your reports? 5 benefits of report automation
We’ve already established a couple of benefits of document automation.
But there are many reasons to invest in this software. Below, we’ve compiled a list of highlights.
- Pull in new clients – With better reporting, you understand your audience. The best software delivers consistent insights, enhancing your ability to pull in new clients and leads.
- Save money – Manual errors can be highly expensive. You spend time and money correcting the problem, so a reliable system saves you money.
- Speed – Automated software processes large amounts of data in seconds. Manually, this takes much longer.
- Staff retention – Employees don’t enjoy admin. Bored employees are more likely to leave. By cutting out repetitive tasks, you hold onto valuable team members.
- Easily share reports – Printing, distributing, and saving reports is a hassle. Automated software will issue reports to the right people as frequently as needed.
4 ways to automate reports
There are multiple ways to handle reporting automation. Let’s take a look at each.
Code-it-yourself system
This approach can provide a solution that is truly tailored to your needs.
Unfortunately, it is far from the simplest option.
It’s complex, and you’ll need an experienced coder with expertise in programming languages like Python and SQL.
Business intelligence (BI) tools
Business intelligence (BI) tools are designed to accommodate large amounts of data.
They provide analysis and comprehensive reports on your data, accessing information from various sources.
Data analytics dashboard tools
Data analytics tools are similar to BI, presenting various insights and reports.
Some present real-time data so that you can make decisions on the go.
The difference between analytics tools and BI is the latter is designed to anticipate future trends based on your data.
Analytics tools have a broader focus and can provide many different insights into data.
Automated reporting tools
Automated reporting software aims to reduce the time spent reporting.
Of all the solutions discussed here, automated reporting tools are perhaps the most accessible.
You can jump straight and get to work on your reports.
Reporting automation tools are designed with accessibility in mind.
Generally, any user can easily navigate the software regardless of technological skills.
How to automate reporting: a step-by-step guide
You’ll now have a better idea of the automated reporting tools available.
But how should you automate the reporting process? Let’s explore some key steps.
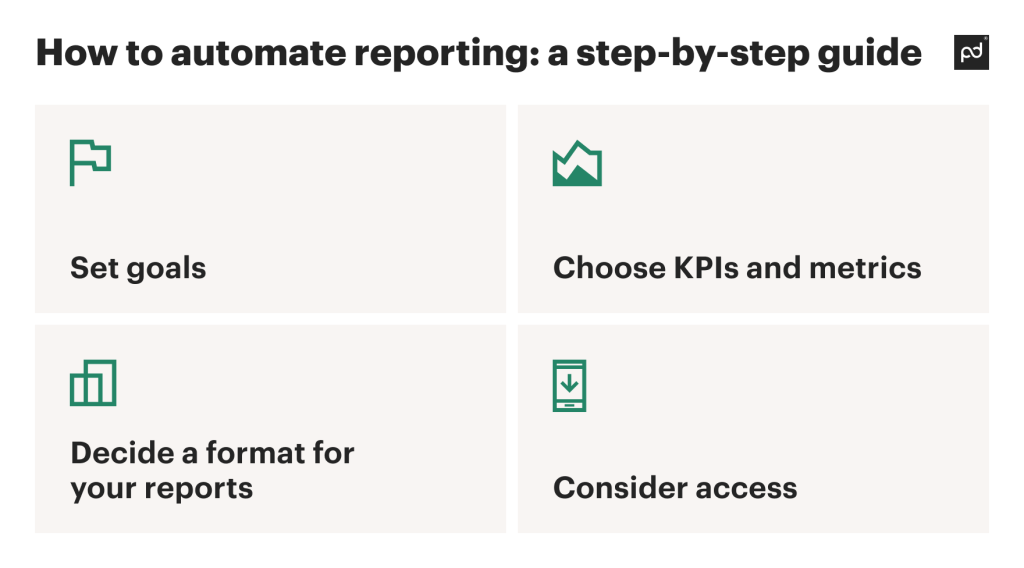
Set goals
What are your automation goals?
To ensure you’re on the right path, you first need a clear set of goals to work towards.
Ask clear questions about issues you have.
Remember, each department has different needs and will have slightly different questions. Let’s look at some examples:
- Do you have slow access to sales data? Would a more efficient system help the sales team to chase leads?
- Is your recruitment process slowed due to manually sifting?
- Do you struggle to keep on top of admin tasks?
Choose KPIs and metrics
You might have lots of data, but raw numbers don’t give the information you need.
Instead, you need metrics to measure progress. This is where key performance indicators (KPIs) come into play.
When choosing your KPIs, try to consider the following factors:
- Consider business goals. Which KPIs best track your progress towards them?
- KPIs shouldn’t be static. Periodic reviews ensure they still meet your goals.
- Think about your industry. Not all KPIs will be useful.
- Stick to a small number of KPIs. Too much information causes confusion.
Decide a format for your reports
How do you want to present your reports? Don’t overwhelm employees with too much information.
Conversely, overly simplistic reports might lack the full picture.
There’s no ‘right’ answer. Think from the perspective of data storytelling. Do your reports deliver a clear narrative?
Use layout and color to emphasize key areas.
Remove irrelevant information that doesn’t support your wider narrative.
Consider access
Modern technology gives people access to data from anywhere. Don’t just give access to employees in the office. Employees will feel more encouraged to use data that is easily available. Enable instant access on the go from an employee’s mobile device.
Report automation top tips and best practices
We’ve looked at some important steps for establishing report automation.
Now, let’s consider best practices to ensure you implement automation smoothly.
- Aim for high-quality data – Your reports are only as good as the data they contain. Remove duplicate or inaccurate data from your database. Update your data frequently to give accurate insights.
- Keep dashboards and reports simple – Employees should easily get to grips with tools.
- Pick appropriate visualizations – If you’re trying to show trends over time, you might opt for a line graph. Or, if you’re showing demographics, a pie chart can be a good choice. Always think about how visualizations help support data storytelling.
- Prioritize security – Handling lots of data comes with an added privacy risk. Implement stringent data protection measures. Update regularly to counter new threats.
What to consider when setting reports up for automation
We’ve discussed a number of key factors to bear in mind when setting up reporting automation.
Let’s quickly recap. When setting up automation, make sure you have:
- An overall goal to guide your wider automation strategy
- A set of relevant KPIs to monitor your progress
- The right visualizations to support your reports
- High-quality, consistent data
What are the best automated reporting tools out there?
There’s no shortage of automated reporting tools on the market.
Let’s look at some of the options.
PandaDoc

If you’re looking to save time and minimize risk, PandaDoc has the solution for you.
PandaDoc’s reporting software is an all-in-one tool for automating tedious, repetitive tasks and building efficient document workflows across your organization.
Our solution helps you to create seamless automated documentation.
With PandaDoc, you can create stunning business documents with zero coding required.
All reports can be customized to meet your unique needs.
Other PandaDoc features include
- Access to a library of over 750 professionally designed templates
- Integration with other key tools like HubSpot and Google Drive
- Automated document processing, allowing you to update documents and implement version control easily.
Google Analytics
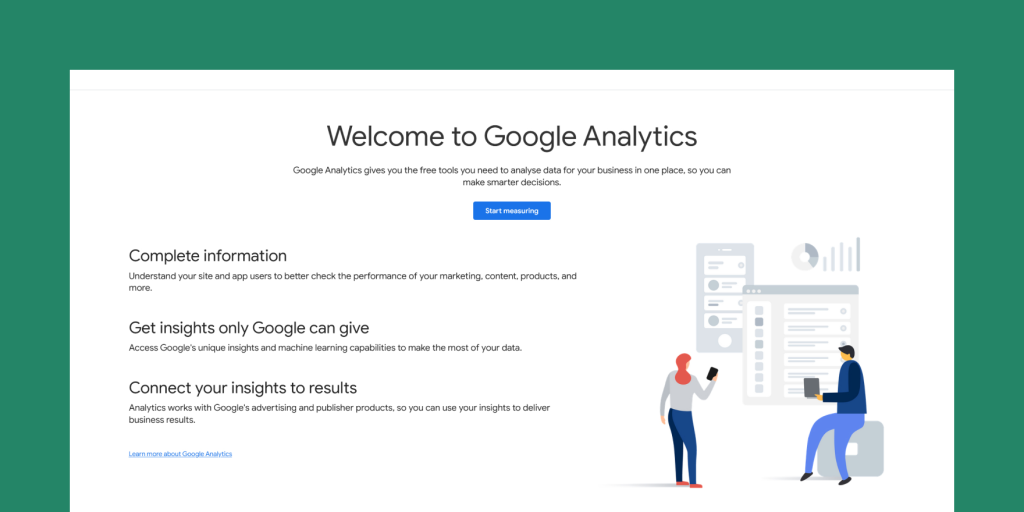
Google Analytics (GA) is a fantastic tool to analyze website usage, giving a real understanding of your audience.
Other GA features include:
- Access to real-time reports – you watch as users navigate your site
- Integrations with tools like BigQuery, Google Tag Manager, and Mailchimp
- Dynamic visualization options to support reporting
Google Data Studio
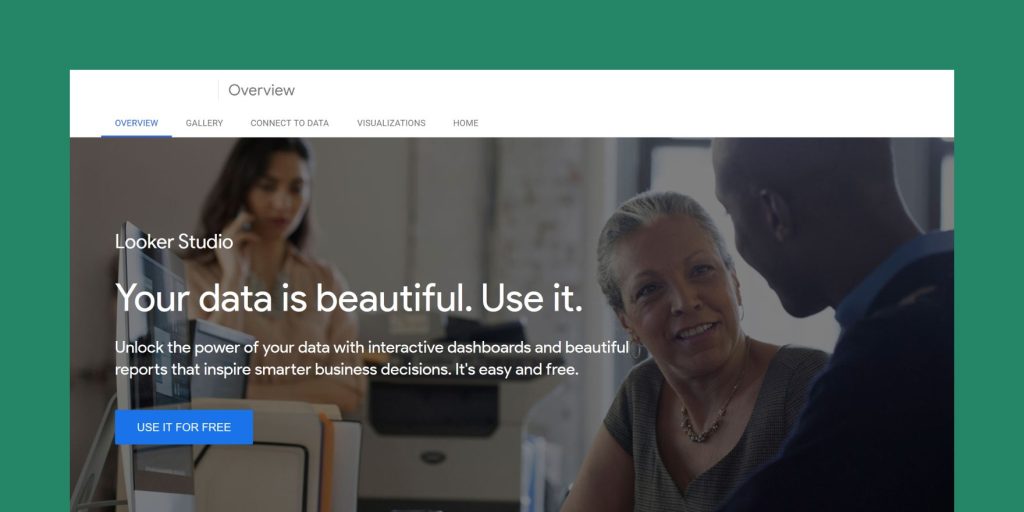
Google Data Studio is a tool for visualizing and connecting your business data, featuring highly customizable reports.
It’s an easy-to-use solution, but its advanced features allow you to create complex reports.
Other Google Data Studio features include
- Easily shared reports – across your organization or externally
- Can be connected with over 500 data sets
- Customizable dashboard – to match reporting to needs
How to select a report automation tool
Whilst there is no correct answer, look for the following essential features.
- Document security and compliance
- Streamlined report automation that minimizes errors
- Smooth collaboration between departments
- Simple and easy-to-use interfaces
Allow PandaDoc automated reporting software to make life easier
Manual reporting can be a millstone around the neck of your organization.
But as we’ve explored, simply settling for any automation software won’t cut it.
You need a flexible solution to meet your business’ current and future requirements.
PandaDoc’s solution has the versatility to meet your needs. We’ll help you cut down on admin and get the most out of your data.
As they say, ‘seeing is believing’.
Why not try our solution for yourself and request a demo today?
Frequently asked questions
-
Depending on your solutions, potentially hundreds of data sources can be used in your reporting. Some examples include Salesforce, Google Analytics, and Apache Hive.
Consider the data sources that are important to you and find a solution that accommodates them.
-
If you create your own code-it-yourself solution, you can create interfaces that truly meet your needs.
Not all prebuilt solutions provide in-depth customization. Some solutions that do are complex and difficult to use. Look for a solution that provides easy-to-customize, drag-and-drop functionality.
-
Implementing strong data hygiene practices is the best way to ensure data accuracy. Get into the habit of auditing your data regularly.
Search for duplicates or any irrelevant information that might be included in your reports. Whenever you spot errors, be sure to remove them immediately.
Sharing data hygiene practices with your wide team can help ensure data accuracy. -
Visualization should be an essential part of your automation. People on your team, especially visual learners, will better understand your reports if they include visuals. Be careful to plan your visualizations.
Not all visuals will support every report. For clarity, always pick visualizations that support data storytelling.
-
The process of scheduling automated report generation will vary based on your automation solution.
What is the purpose of the report, and how often do you need to be updated? This will determine the frequency. For example, during a marketing campaign, you will probably need multiple daily reports.
-
To measure the success of your automation, you need a clear set of key performance indicators (KPIs). These should be built around your broader automation goals. That’s why, for beginning any reporting automation, it’s important to ask, ‘What do I want to accomplish?’
-
The best automation systems allow you to integrate with business systems. Researching and ensuring a solution meets your integration needs is always important. For example, if you’re creating an employment report, it’s vital that your automation tool integrates with payroll software.
-
Automation challenges differ with each solution. Below are a few general examples and solutions for overcoming them.
- Employees struggling with new systems – Provide education and learning resources
- Employees not understanding reports – Introduce visualizations to support data storytelling
- Lack of customization – Identify a solution tailored to your needs